 RU
RU
Application of Target Curve in Smaart v8
Sound customization tools
Sound customization tools

In this article, I'll share a tool that will allow you to look at sound tuning in the area of amplitude-frequency response from a different perspective and help you find the result that will satisfy you and those around you.

I've often encountered on-stage situations where novice sound engineers and sound producers set up sound with a flat shelf, that is, absolutely linearly across the entire range of the system's operation, just like straight-A students on an exam.
But is this right?
This may be true for the 99% in recording studios, where monitoring plays a crucial role in content creation and where inaccurate musical data at the output can ruin the entire product.
And at concert venues, we need powerful, punchy sound that will delight the audience—at least the majority of them. Physics is physics, but sound, or rather its perception, is a highly subjective thing, and the debate about how it should be will probably never end.
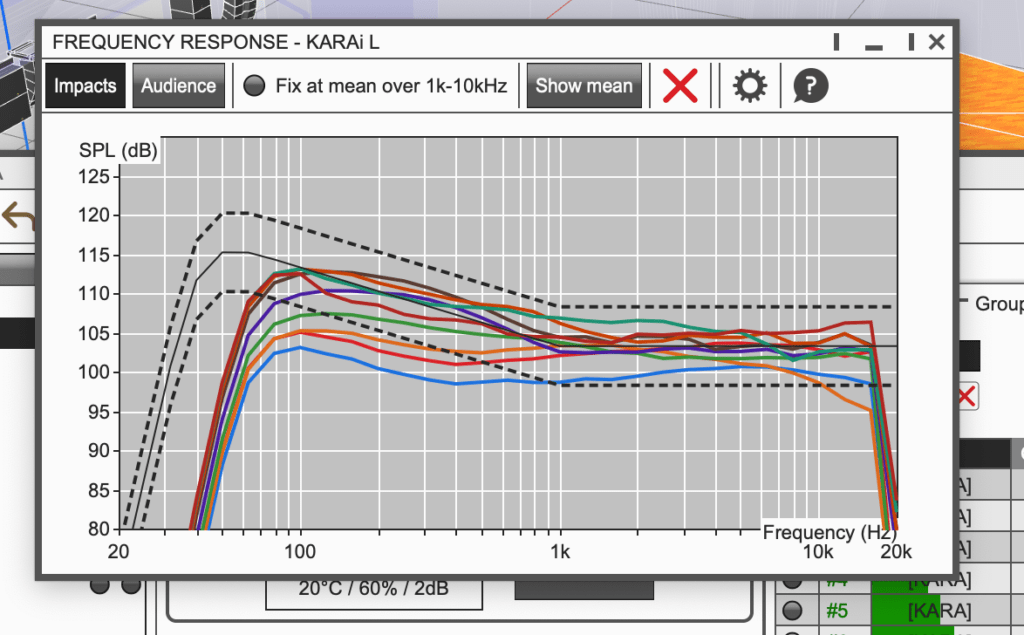
Top acoustic system manufacturers don't create perfectly flat sound when creating presets for their speakers. Instead, they rely on feedback from sound engineers and technical focus groups to formulate their sound design. L-Acoustics is an example. In the Soundvision program, we see a smooth 10-dB rise in the frequency range from kilohertz to 40 hertz.
In Smaart, we can use the Target Curve, which we can use to shape our signature sound. It will essentially be our guide when setting up sound on the site.
Now let's get down to business..
In essence, a beautiful line on a graph is txt a file in which there is an information component for each frequency.
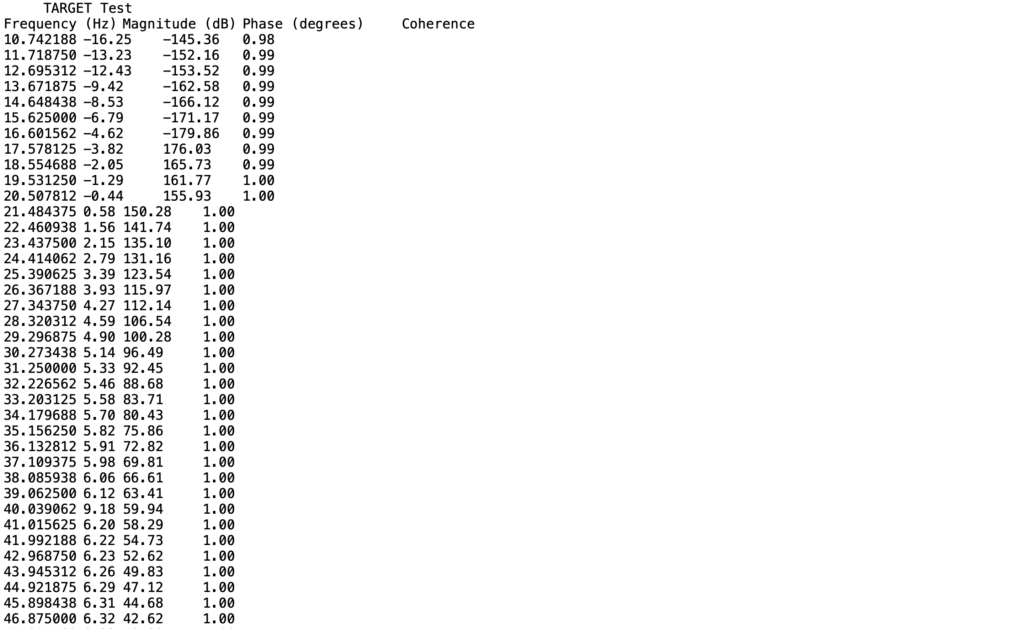
The target curve can be created and integrated in several ways:
The first method, like the second, is quite labor-intensive and not always cost-effective. Therefore, we will consider the third implementation option.
There is a fairly competent American sound engineer, Nathan Lively, and he, drawing on his extensive experience, created curves that satisfy me to this day.
Download the archive from the link https://www.sounddesignlive.com/target-traces/
Click the link, enter your email address, and download the archive. Once unzipped, open Smart.
Next, in Smaart, follow the path File - Import - Target Curve
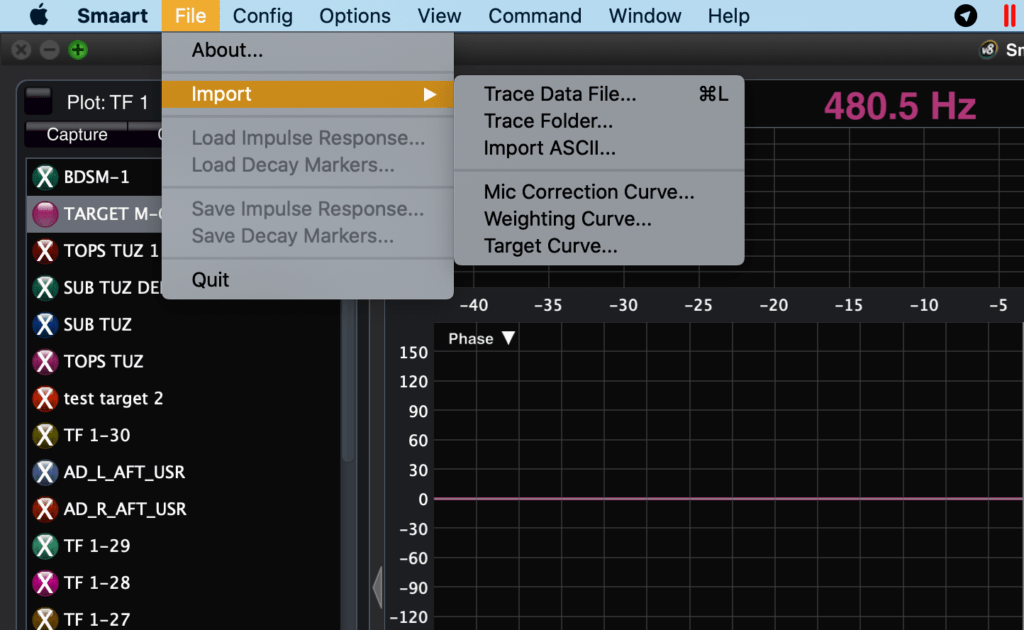
Next, go to the unpacked folder that we downloaded from the link and select the file TARGET M-Otsd-Top
And that’s it, miracle, the curve is now on your graph and is ready to help you achieve your goals.
It's important to understand that the curve is just a guideline, not a goal in itself, so use it wisely. And remember: the target curve corrects the hall's acoustics and tuning, but it doesn't faulty equipment — a burnt-out driver or a tired amplifier is first repaired, then tuned.
We perform measurements and tuning of sound systems using the target curve: Smart measurements, frequency response correction, and delay equalization. We bring our own measurement kit—microphones, sound cards, and a reference path. We also perform sound system audit, installed by other contractors, with a measurement protocol and specific recommendations.
A smooth curve won't save you if the hardware in the audio system is faulty: weak speakers, distorted THD in the amplifier, noisy control panel channels. An equalizer won't fix this. We test the equipment on a test bench with a frequency generator and spectrum analyzer—we find things that aren't audible to the naked eye but are ruining the sound. Diagnostics and repair of audio equipment — free diagnostics for subsequent repairs, 6-month warranty.
Author of the article: Andrey Shmakov